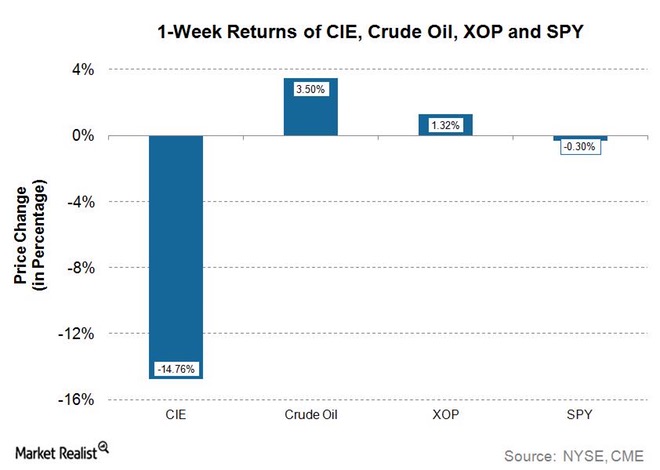
Cobalt International Energy (NYSE:$CIE), a mining company focused on the drilling and exploration of oil fields, saw its stock prices underperform crude oil just the week of May 8th to May 12th. The offshore oil ($USO) and gas ($UNG) producer saw its stock price fall from $0.31 to $0.26, a price change of -14.76%, while crude oil rose from $46.22 per barrel to $47.84 per barrel (a price change of 3.50%). Investors who were invested in Cobalt were definitely not having a good week.

The reason for this fall was largely due to its earnings report. CIE announced its 1Q17 (first quarter 2017) before the market opened on May 8, 2017 — reporting an expected loss of $69 million, a loss that even Wall Street analysts were not expecting. Compared to its performance in 2016, CIE’s stock prices are not looking great. Around this time last year, on May 17, 2016, the stock hit a 52-week high at $2.80. On May 11, 2017, the stock hit a 52-week low of $0.25.
Medium-term price trends
Despite the 84% rise in crude oil prices from February 2016, the company’s stock price has been unable to rise along with it. From February 2016, CIE’s stock price declined from $2.02 to $0.26 while crude oil prices rose from $26.05 to $47.84.
As of now, CIE is trading below its 50-day and 200-day moving averages — on May 12, 2017, CIE’s stock prices closed at $0.26, whereas its 50-day moving average was $0.43 and its 200-day moving average was $0.93.
Fiscal 2017 — an outlook
CIE is currently focused on exploring the deepwater U.S. Gulf of Mexico; however, its lack of production thus far along with a debt of $2.5 billion is a major concern for the company. In its 1Q17 report, CIE expects its total cash outlays to be around $550-$650 million, and that the company had spent around $196 million.
It seems as if CIE is the only oil and gas exploration/production company that is seeing such losses — Marathon Oil (MRO) saw a rise of 0.28% and Occidental Petroleum (OXY) rose 0.78% from May 8th to May 12th. In general, oil and gas exploration and production companies (XOP) outperformed the S&P 500 ETF (SPY) during this period of time.
Featured Image: twitter


