In recent trading sessions, the price of gold and other precious metals have risen, a happy sign for all those with gold investments. This bullish price action was quite unexpected due to the fact that in recent weeks, almost all commodities have struggled to outperform other market segments. However, this upturn of events might not hold, as all investors know just how unpredictable the market can be.
Below, we try to determine the best way to profit from gold investing in the next few months by analyzing the charts of some important exchange-traded products.
SPDR Gold Shares ($GLD)
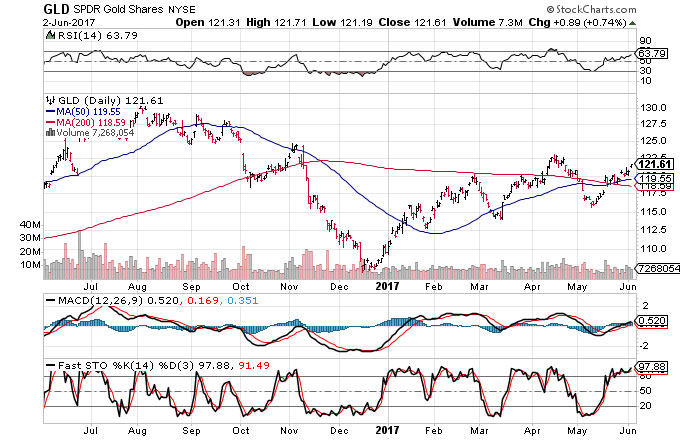
When conducting technical analysis, traders will often consider common levels of support and resistance of a trade, like the 50-day and/or 200-day moving averages. Long-term moving averages are especially important when it comes to gold investment, as it has had a great influence on the prices of the metal.
The recent break above $118.59 has coincided with a bullish crossover between the 50-day and 200-day moving averages. This typically signals the start a significant uptrend, a piece of favourable news to all those in gold investment with money put into this share. Based on the chart of SPDR Gold Shares, most bulls will try and protect their long positions by making stop-loss orders below $119.50 or $118.50 depending on risk tolerance.

VanEck Vectors Gold Miners ETF ($GDX)
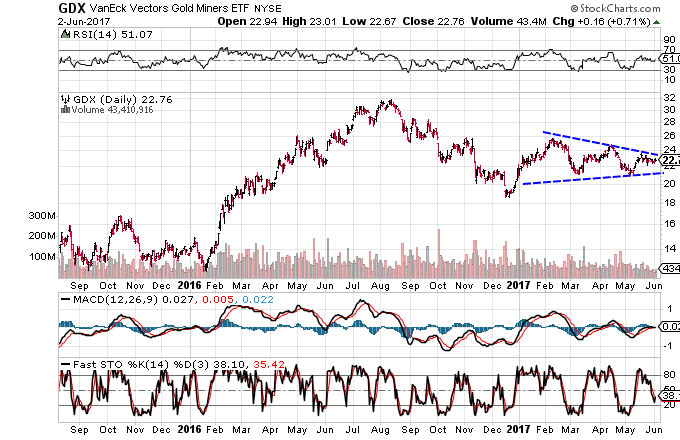
Traders wanting to get into gold investing by looking for exposure to gold mining will usually look to VanEck Vectors Gold Miners ETF (GDX). The ETF consists of 53 holdings that stretches across all aspects of the gold mining industry.
The price is trading between two converging trendlines, a phenomenon known as the triangle pattern. If you made your gold investment in this ETF and is a bullish trader, pay close attention to the price action near the top of the range. A break above will mean a breakout that will most likely be followed by a rise in buying pressure.

VanEck Vectors Junior Gold Miners ETF ($GDXJ)
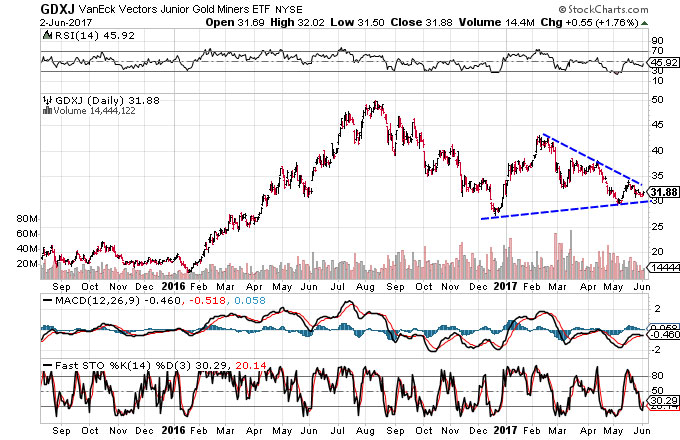
This is another popular ETF that is constantly being watched by those in gold investing. The ETF is made up of several promising gold mining companies that is just starting up. Like the VanEck Vectors Gold Miners ETF, this fund also shows a triangle pattern. Converging trendlines could mean that a major move in price will happen in the next few weeks. The direction of the move can be predicted by a couple of consecutive closes beyond either the upper or lower trendline.
With the rising price that is happening to gold, an upward bias is present amongst those with investments in gold. Many bulls will be preparing to make a buy order on a close above $34.17.

Featured Image: Depositphotos/© BrianAJackson


