Out of all of the advice that Warren Buffett has given, the following might be the most important: Be fearful when others are greedy, and be greedy when others are fearful. When trying to measure the level of fear in a certain stock, look at the technical analysis indicator called the Relative Strength Index (RSI), which measures momentum on a 0 to 100 scale. If, for instance, the RSI reading falls below 30, that stock is thought to be oversold.

In trading on July 18, AT&T (NYSE:$T) shares entered into oversold territory, reaching an RSI reading of 29.7, after changing hands as low as $35.87 per share. To put that into perspective, the RSI reading of the S&P 500 ETF is 62.7.
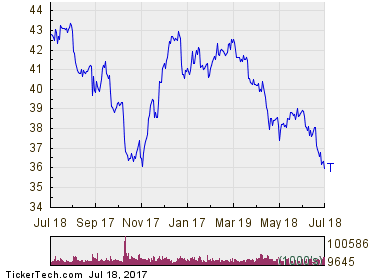
In the mind of a bullish investor, the 29.7 RSI reading on Tuesday could be seen as a sign that the recent heavy selling is on the verge of exhausting itself, and might be an inkling to look for entry point opportunities on the buy side. Below is a chart that shows the one year performance of T shares:
When looking at the chart, we can see that AT&T’s low point in its 52 week range is $35.87 per share, with $43.50 as the 52 week high point.
Featured Image: twitter


